Choosing the Right Tool: Fishbone Diagram vs. Cause and Effect Matrix for Root Cause Analysis
Root Cause Analysis (RCA) is the backbone of Lean Six Sigma, a vital skill that unveils the underlying culprits behind defects, errors, and waste. It’s the compass that guides us in the journey of process improvement. But, how do you pick the right tool for the job? In this article, we’ll compare two commonly used RCA tools, the Fishbone Diagram and the Cause and Effect Matrix, and provide insights to help you make the right choice for your specific needs.
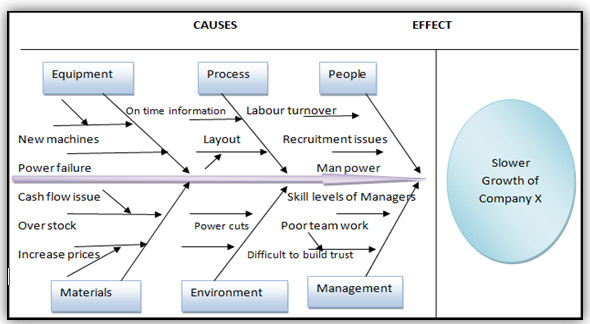
Fishbone Diagram: The Creative ExplorerAlso known as the Ishikawa diagram or the Cause and Effect diagram, the Fishbone Diagram is a visual tool that helps you dissect the potential causes of a problem. Think of it as a fish skeleton, with the main issue or effect as the head, and the major categories of causes as the bones. Each category can have subcategories or branches representing more specific causes. The Fishbone Diagram encourages brainstorming and categorization, letting you identify the root causes that demand further scrutiny or action.Cause and Effect Matrix: The Rational PrioritizerThe Cause and Effect Matrix, also known as a C&E Matrix or X-Y Matrix, is a tabular tool designed to prioritize potential causes based on their impact and frequency. It lists the problem or effect as the output variable (Y) and the potential causes as input variables (X). Each input variable receives a score reflecting its strength and frequency. These scores are then summed to rank the input variables from highest to lowest priority. The Cause and Effect Matrix enables you to concentrate your resources on the most critical causes and allocate them effectively.Choosing Between the TwoBoth tools have their merits, yet their strengths and limitations set them apart. The Fishbone Diagram is ideal for complex or ambiguous problems requiring comprehensive analysis. It thrives on creativity and collaboration, allowing different perspectives in the brainstorming process. However, it can sometimes generate an overwhelming number of causes, challenging their verification and testing. In contrast, the Cause and Effect Matrix is a better fit for simpler, more straightforward problems. It provides a quick, quantitative analysis, based on data and evidence, but might be subjective and biased, relying on your judgment and assumptions.Tips and Best PracticesTo decide between the Fishbone Diagram and the Cause and Effect Matrix, consider the nature and scope of the problem, data availability and quality, the purpose of your RCA, and project constraints. Sometimes, one tool may stand out as more suitable, but combining them can also be a powerful approach. For instance, use the Fishbone Diagram for brainstorming and organizing causes, then employ the Cause and Effect Matrix for prioritizing and selecting them. Or, begin with the Cause and Effect Matrix to narrow down causes, and turn to the Fishbone Diagram to explore and validate them.Examples and ApplicationsLet’s take a closer look at how to choose between these tools with real-world examples. In the manufacturing industry, where reducing the defect rate of products is a complex challenge, the Fishbone Diagram shines. With many variables affecting quality and inconsistent data, this visual tool helps identify potential causes. Teams across the organization collaborate in the analysis. Data and tests are employed to verify and validate causes, paving the way for targeted corrective actions.On the flip side, a service company aiming to boost customer satisfaction is dealing with a simpler problem. Factors affecting satisfaction are few and well-defined, with reliable data available. The Cause and Effect Matrix helps rank and select the important factors, relying on solid evidence to support the analysis. Measuring and monitoring these factors through feedback and surveys provides a clear path for improvement.In the world of Lean Six Sigma, choosing the right tool is the first step towards eliminating waste, improving efficiency, and driving excellence. Select wisely, and you’ll be on the road to solving complex problems and enhancing your business’s quality and efficiency
English
English
Dutch
Polish
English
English
Dutch
Polish
Report
There was a problem reporting this post.
Block Member?
Please confirm you want to block this member.
You will no longer be able to:
See blocked member's posts
Mention this member in posts
Invite this member to groups
Message this member
Add this member as a connection
Please note:
This action will also remove this member from your connections and send a report to the site admin.
Please allow a few minutes for this process to complete.